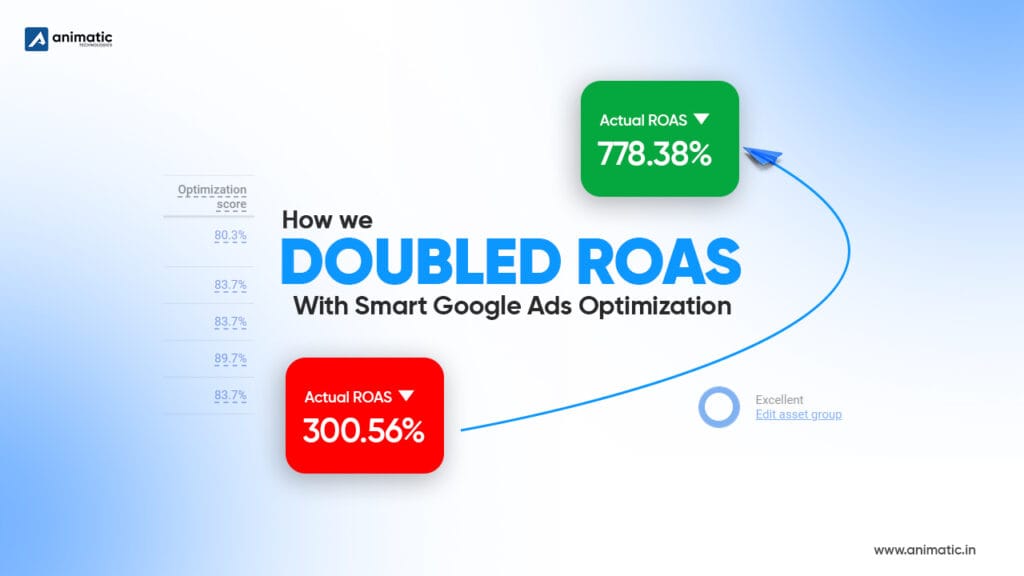
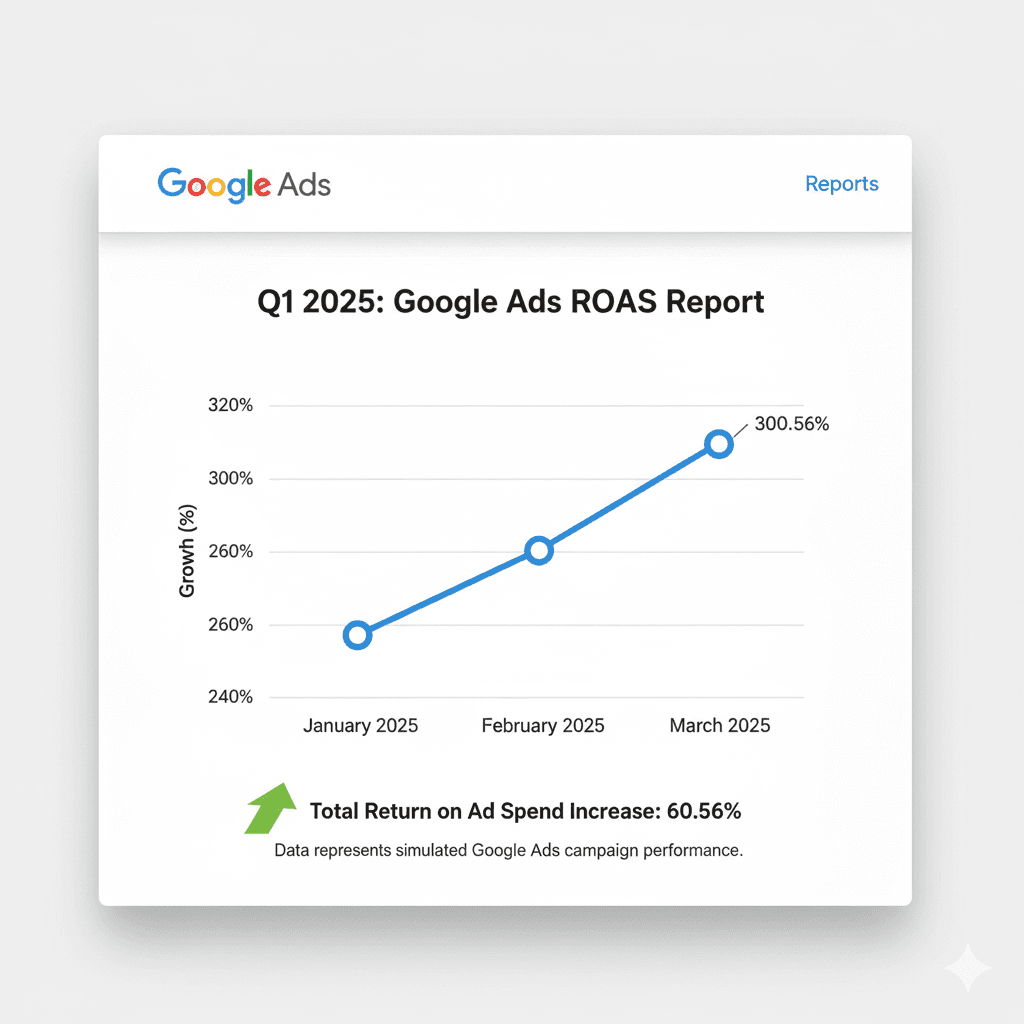
At Animatic Technologies, we’re constantly striving not just for better numbers—but for smarter growth. In early 2025, our team faced a familiar challenge: despite steady ad spend and healthy traffic, our Google Ads Return on Ad Spend (ROAS) was stuck around 300%. For our clients, that’s not enough. Here’s the exact, data-backed story of how we turned things around!
The Problem
We noticed our ad spend just wasn’t pulling its weight. Here’s what we saw:
Stagnant ROAS: Hovering near 300%, often dropping after short-lived spikes.
Broad Ad Groups: Tons of unrelated keywords lumped together, making it impossible to track which offers were actually working.
Shopping Campaigns: Product titles were uninspired, we weren’t even using half the available attributes, and mobile images looked off.
Lack of Personalization: Limited use of audience segments—missing out on remarketing and intent-based groups.
What We Did—Step by Step
1. Ad Group Deep Dive (February)
Pulled keyword search term reports to identify high-performers and total duds.
Broke up generic ad groups into hyper-focused themes. For a fashion ecom client, we went from “Men’s Shoes” to “Men’s Running Shoes,” “Men’s Formal Shoes,” etc.
Used negative keywords to trim junk clicks and limited overlap.
Enabled budget adjustments so we could double-down on themes driving profit.
2. Performance Max (PMax) Asset Overhaul (May)
Rewrote headlines and descriptions, including more USPs—“Free Shipping,” “Next Day Delivery,” “Rated 4.9★ by 1500+ Customers.”
Added new creative assets: product videos, seasonal banners, and testimonials.
Layered audiences: in-market shoppers, remarketing lists, and custom intent groups based on analytics.
Used asset group reporting to see which combinations worked best, then replaced underperformers monthly.
3. Shopping Campaign Tune-Up (July–August)
Went deep optimizing the feed: improved all titles (now formula-based: Brand + Product + Feature + Size/Color), added GTINs, extra attributes, and photo angles.
Split Shopping into tiered campaigns by product value (e.g., “Best-Sellers,” “Clearance Stock”).
Segment by device and geo—mobile-specific push for key areas.
Bid up on loyal customer lists and top revenue segments.
Monitored “Search Impression Share” and trimmed wasted spend.
4. Automated Rules & Real-Time Monitoring
Set rules for bid increases on ad groups topping 500% ROAS, and budget pulls for those slipping below 200%.
Established weekly funnel reviews—team huddles to spot any slipping trends early.
Used the “Change History” log to ensure we could trace every tweak to the results.
The Results
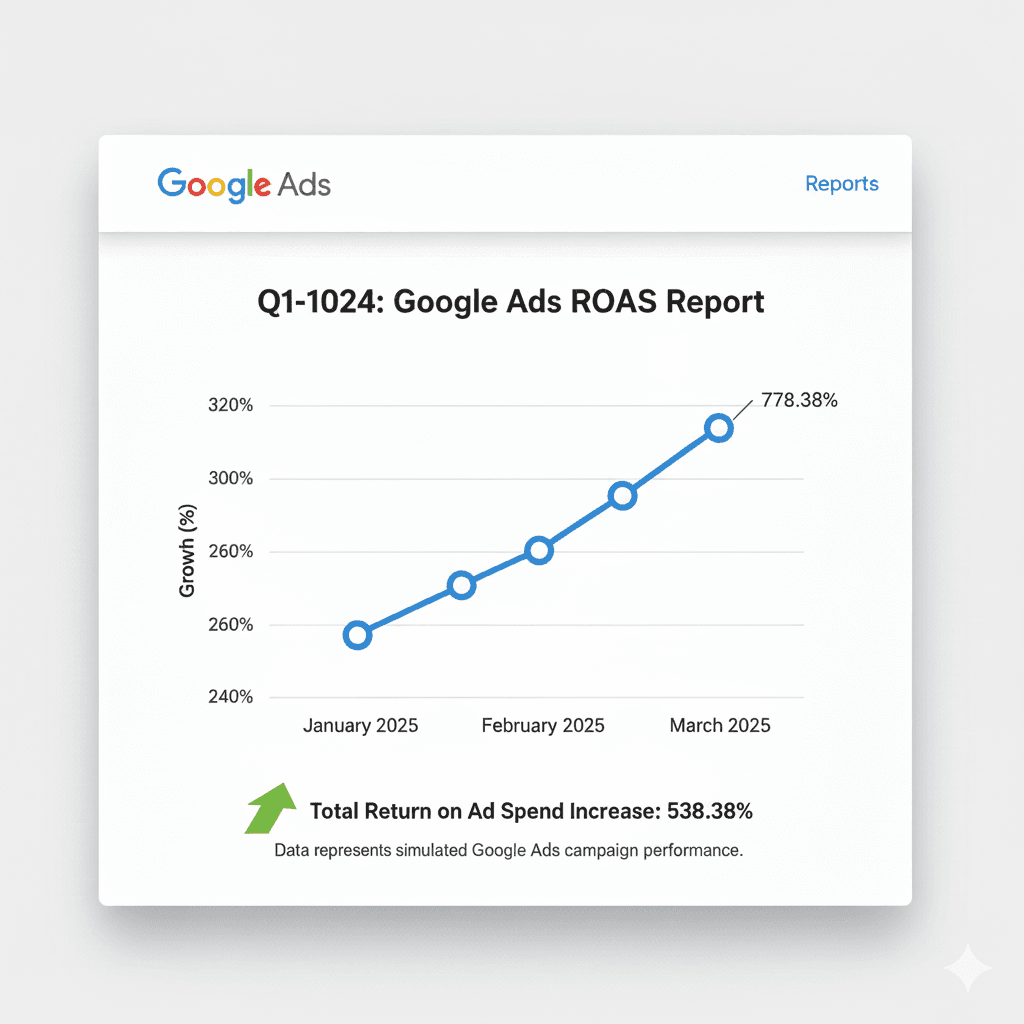
The Numbers:
ROAS grew from 300% in January to 700% by November!
Cost per conversion dropped 52%.
Revenue from Google Ads more than doubled versus prior year, with the exact same or slightly reduced spend.
CTR rose ~45%; impression share increased 60–80% across core groups.
Other Wins:
Deeper funnel tracking revealed which audiences and assets actually closed the sale—not just drove clicks.
Real “Aha!”: Sometimes, just a concise, benefit-driven headline or more authentic user photo outperformed everything else.
What We Learned
Niche > General: Smaller, relevant groups outperform broad, “catch-all” themes every time.
Assets Drive Results: Video and clean, trust-building headlines weren’t fluff—they drove conversion spikes.
Automate—but Monitor: Automated rules prevented waste, but human review was still key for creative and trend-spotting.
Feed Optimization is Gold: Clean, specific product data in Shopping is often the “unseen hero” of great ROAS.